Next: About this document ...
Up: Pathology of GraphEnt calculations,
Previous: My native Patterson function
Contents
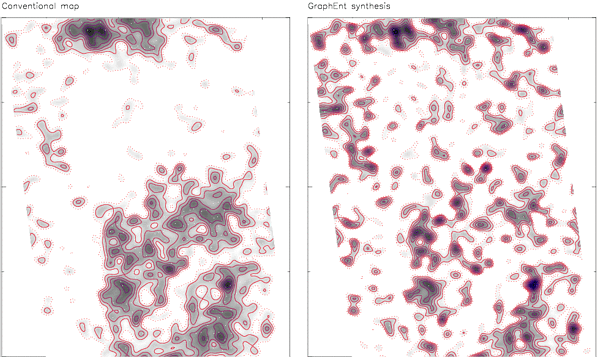
My molecule disappeared from the GraphEnt EM projection map.
Electron microscopy data quite often have a problem with the estimated standard
deviations of the amplitudes. Let me illustrate this with an example.
The figure below compares the conventional and GraphEnt maps for a 8Å potential density projection of a large complex.
Figure:
Problematic EM projection
 |
It looks as if all low resolution information disappeared from the GraphEnt map,
and this is more-or-less what has indeed have happened. The reason is shown
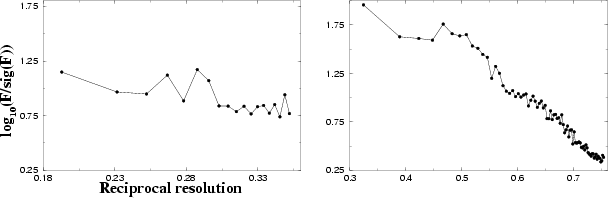
in the next figure. The two graphs show on the same scale the distribution of
log10(F/ (F))
versus resolution for the EM data (left graph) and of a typical X-ray
crystallographic data set (right graph).
(F))
versus resolution for the EM data (left graph) and of a typical X-ray
crystallographic data set (right graph).
Figure:
Distribution of F/sig(F)
 |
Whereas the X-ray data have a
dynamic range extending approximately over two orders of magnitude, the EM
data show a flat distribution with the (strong) low resolution terms having a
value of
F/(F) not much different from the data in the highest
resolution shell. Because I have seen this behaviour with almost all EM data
sets that I have come across, I suspect that the problem is with the data
processing programs used by the EM community.
Next: About this document ...
Up: Pathology of GraphEnt calculations,
Previous: My native Patterson function
Contents
NMG, Nov 2002